Portrait: Web-Based Debug Visualization Tool
Overview
Portrait is an interactive web-based debug visualization tool for inspecting the execution of compiled tungsten programs on the Cerebras fabric simulator. It provides a multi-panel browser interface for exploring tile layout, pipeline execution, source code correlation, wavelet traffic, and instruction-level detail.
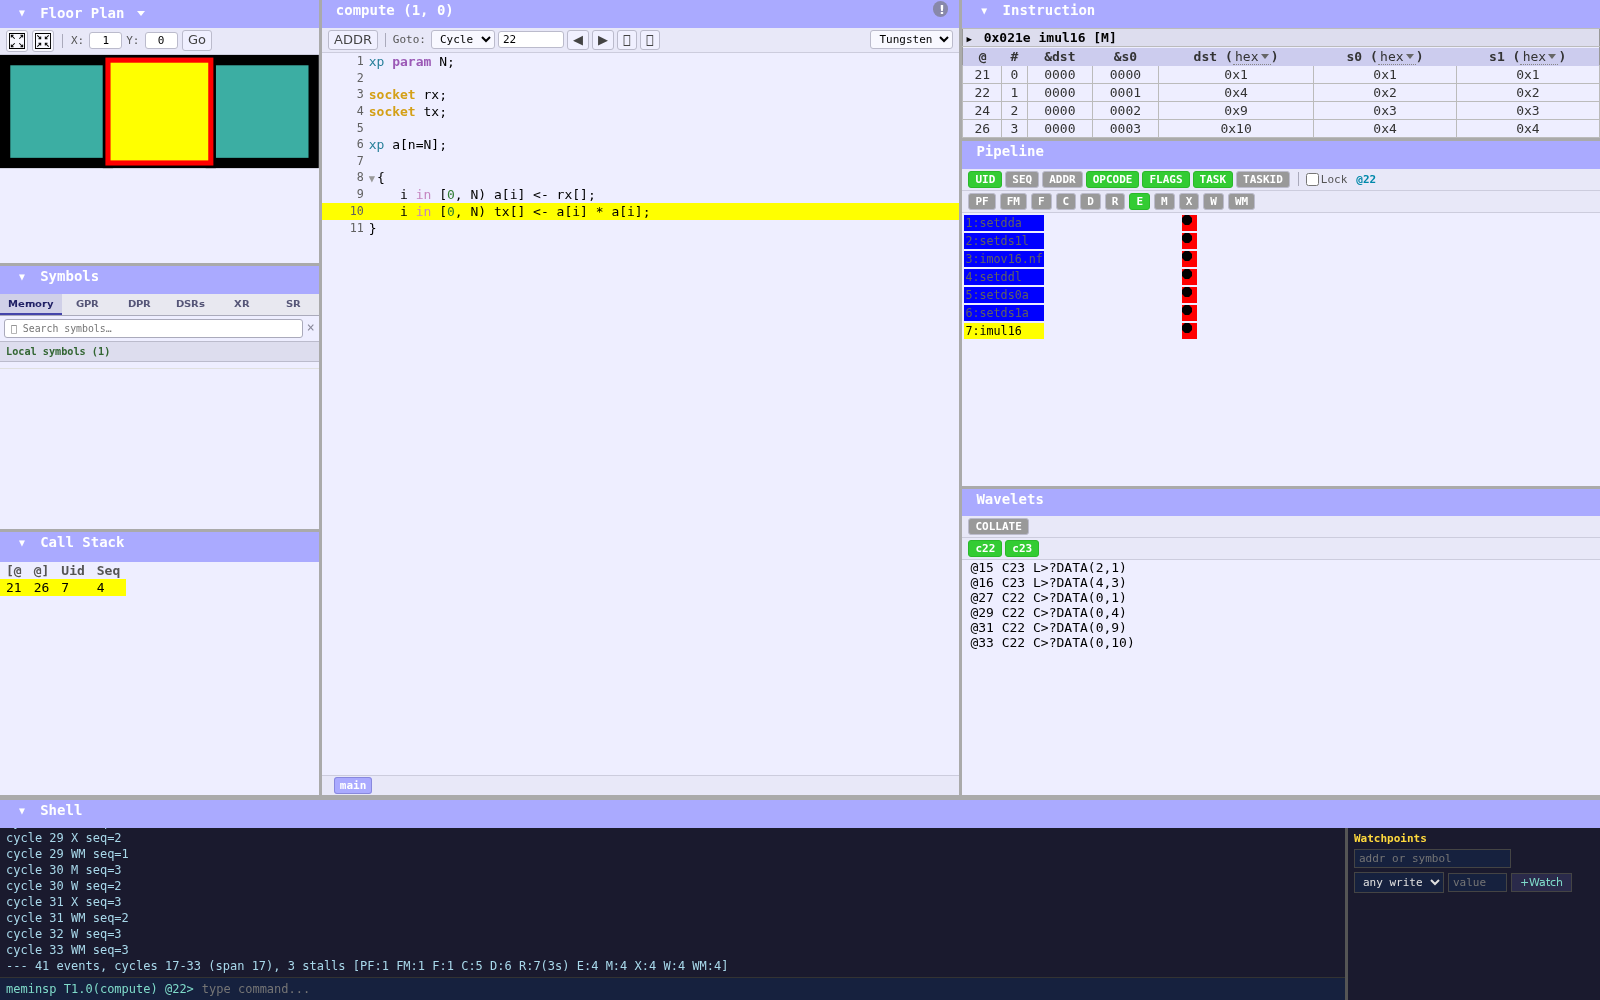
Portrait on a three-tile pipeline, the program of the tutorial's lesson 4 with one receiver instead of two, built with make TEST=tutorial GOAL=debugx DEBUG="router wavelet". Selecting the compute tile and then its imul16 in the pipeline highlights line 10 of compute.w, lists the four multiplications in the instruction panel, and traces the instruction in the shell.
Usage
Launching Portrait
After running a test in debug mode (make TEST=<id> GOAL=debugx), start
Portrait in the test's directory. A test.rc row with a name runs in
test-<name>/, so for a tutorial row:
cd test-tutorial/
portrait
Portrait prints the address to open in a web browser:
http://<hostname>:8080/paint.html
Portrait listens on every network interface and checks no credentials: anyone who can reach its port can use it and pass options to the programs behind its views. Run it only on a trusted network. Stop Portrait with Ctrl-C.
Command-Line Options
| Option | Default | Description |
|---|---|---|
port=<N> | 8080 | HTTP server port, e.g. portrait port=8123 |
quiet=1 | 0 | Do not print the address |
Environment Variables
| Variable | Default | Description |
|---|---|---|
CEREBRAS_PORTRAIT_STATIC_PATH | ../share/portrait | Directory containing static web files (.html, .js, .css) |
CEREBRAS_PORTRAIT_DYNAMIC_PATH | ../lib/portrait | Directory containing the programs behind the memory, trace and pipeline views |
Required Files in Working Directory
Portrait expects these files in the directory where it is launched:
| File | Description |
|---|---|
region.json | Tile geometry and region hierarchy |
landing.json | Wavelet landing trace data |
listing.json | Source code ↔ assembly address correlation |
pipeline.bin | Binary pipeline execution trace |
bench.map | Symbol address map (optional, enables Symbol Map panel) |
The first four are produced by make TEST=<id> GOAL=debugx and extracted from bench-debug.tar. bench.map is also produced during the debug build and remains in the test directory.
Interactive Features
Floor Plan (SVG Chip Map)
- Pan: Use the arrow buttons
- Zoom: Zoom in/out buttons
- Click a tile: Triggers cascade of updates across all panels:
- Highlights the tile (yellow rectangle)
- Updates Tile Report, Symbol Map, Region Tree, Source Code, Pipeline, and Wavelet panels
Region Tree
- Collapsible tree showing the hierarchical fabric topology
- Clicking a node with trace data shows the paint source callstack
- Selected spaces are highlighted when a tile is clicked on the floorplan
Source Code Listing
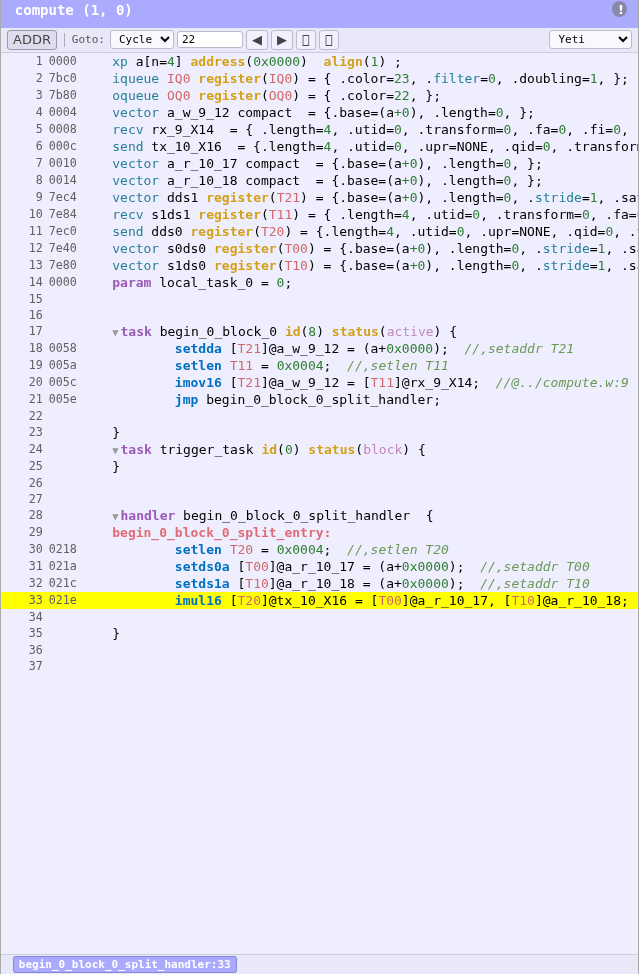
- Shows the selected tile's Tungsten source or its Yeti assembly, chosen from the drop-down at the right of the toolbar
- Each line shows:
[lineNumber] [memoryAddress] [code]; ADDR shows or hides the addresses - Click on a memory address → shows callstack for all instruction instances at that address
- Cross-highlighting with pipeline:
- Hover on pipeline stage → highlights corresponding listing line (cyan)
- Click on pipeline stage → highlights listing line (yellow) and shows instruction detail
Pipeline View
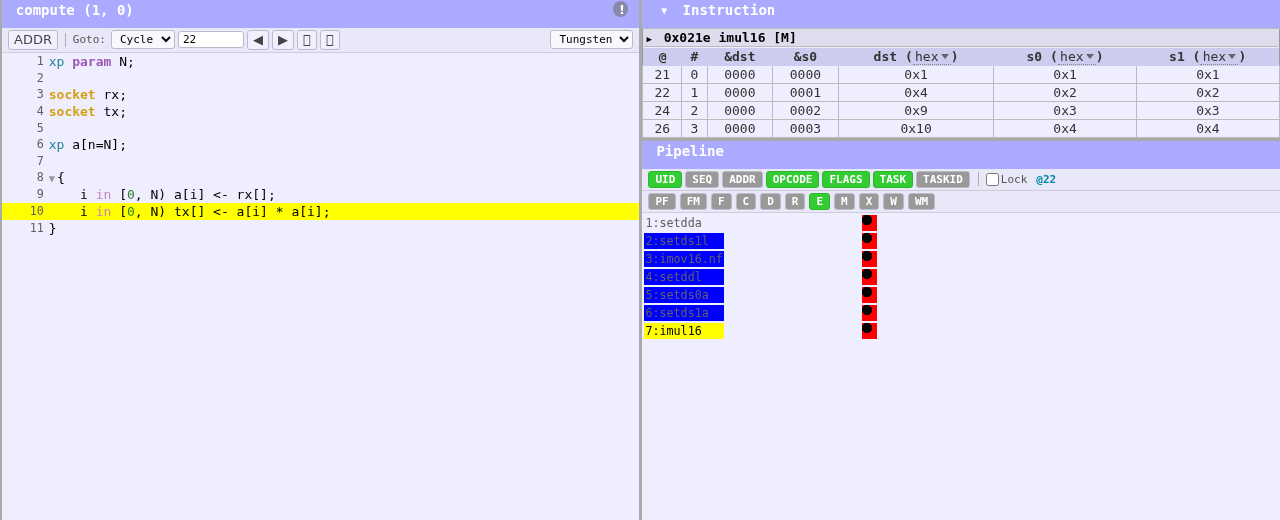
Two display modes toggled via the TASK button:
Pipeline Mode (default):
- Table with one row per cycle, columns for pipeline stages (architecture-dependent):
- SDR (11 stages):
PF | FM | F | C | D | R | E | M | X | W | WM
- SDR (11 stages):
- Stage buttons are dynamically generated based on the architecture reported in
pipeline.bin - Display toggle buttons:
- UID (default ON): shows instruction UID number
- SEQ: appends
.seqsuffix to displayed content (e.g.,42.3) - ADDR: shows hex memory address
- OPCODE: shows instruction mnemonic name
- FLAGS: highlights stalled stages with pink background
- TASK: switches between pipeline detail and task graph views
- TASKID: appends
:T08task ID suffix
- Stage visibility toggles: dynamically generated buttons for each stage (multi-select in pipeline mode)
Task Graph Mode:
- Gantt chart-like visualization showing which task/micro-thread occupies the pipeline over time
- Defaults to E stage (Execute) when first entering task mode; remembers explicit stage selection
- Stage buttons switch to exclusive selection mode (single stage shown at a time)
- Per-task color coding (12 HSL colors by task ID: t00–t0b)
- Pend/block columns show active (
ACTVT) and blocked (BLK) task bitmasks - Hover tooltips: run cells show
uid:N addr:0xABCD OPNAME task:T; pend/block cells showTN pend|block|pend+block @cycle
Search Box: Enter a UID number to jump directly to that instruction in the pipeline, listing, and callstack views.
Instruction Detail
When an instruction is selected (via pipeline click or listing click):
- Instruction mnemonic (e.g.,
FMACH,LDA,MOV) - Per-execution operand table with columns:
- Cycle, Index, Dest address, S0/S1/S2 addresses, Dest/S0/S1/S2 values
- Format engine dropdowns: Each value column has a dropdown to reinterpret as:
hex,u16,i16,u32,i32,u64,i64,f16,f32,cf
- Format preferences persist in
localStorage
Wavelet Log
Shows wavelet (message) traffic for the selected tile.
Two display modes:
| Mode | Description |
|---|---|
| List | Chronological log with timestamp, color, direction, control/data, raw values |
| Collate | Wavelets grouped by color channel (up to 24 colors) in columns |
Per-column display toggles:
@— show timestampsC— show color channel>— show route direction (R/U/L/D/C)- Raw ctrl/data values
Data format toggles:
$— raw hexxi— index:half-precision32— single-precision float16— two half-precision floats- Control wavelets:
#(raw) orX(decoded switch commands: ADV/RST/TDN/NOP)
Color filters: Buttons c0–c23; only channels with actual data show their button.
Symbol Map
- Displays all symbols from
bench.mapwhose coordinate range covers the selected tile - Single-column layout: each symbol shown as a named entry with array dimensions (e.g.,
router[r:24]) - Hover popup: hovering over a symbol reveals a detail panel showing:
- Address: hex W address for this specific tile
- Size: total number of words
- Type: data type when available
- Width:
dword(only shown for double-word symbols)
- If
bench.mapis not present, the panel shows a "not available" message gracefully
Tile Report
- Shows scope path (e.g.,
mymodule.submodule @T5.3) - Displays coordinate values from replicated dimensions
- Key-value pairs from region metadata
Route Plan
- Table showing routing configuration per color per space
- SVG arrow icons visualize routing directions (R/U/L/D/C)
- Cross-highlights with floorplan on tile selection
Shell
The Shell panel at the bottom of the window (click its title bar to open it) is a command line over
the selected tile's state at the current cycle; help lists its commands:
- Symbols:
symbols,info <symbol>,addr2sym <addr> - Registers:
reg,reg <name> [format],reg <group>(for examplereg gpr) - Watchpoints and breakpoints:
watch <addr|sym> [cond val],bp <addr>,breakpoint <uid>,run,continue - Tracing:
uid <n>jumps to an instruction;trace pipeline [uid]prints its path through the pipeline stages, cycle by cycle, with its stalls - Helpers:
call <fn> <args...>runs a helper, such ascall packlen 10 20 30to pack a tensor shape into a DSD length field;waveinfo <ident>decodes a wavelet identifier

Call Stack
- Lists all execution instances of a given instruction address
- Columns: start cycle, end cycle, UID, sequence count
- Click → jumps to that UID in pipeline and listing views
- Hover → highlights corresponding listing line and pipeline entry